
Dosya:IQ curve.svg

Bu SVG dosyasının PNG önizlemesinin boyutu: 600 × 480 piksel. Diğer çözünürlükler: 300 × 240 piksel | 960 × 768 piksel | 1.280 × 1.024 piksel | 2.560 × 2.048 piksel.
Orijinal dosya (SVG dosyası, sözde 600 × 480 piksel, dosya boyutu: 9 KB)
Özet
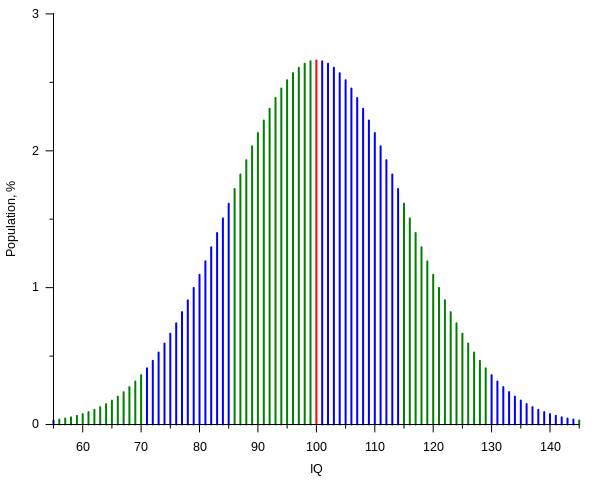
| Açıklama | Current IQ tests typically have standard scores such that the mean score is 100 with each standard deviation from the mean counting for 15 IQ points.[1] The plot shows, assuming that such scores have a normal distribution, the percentage of people getting a score versus the score itself, from 55 to 145 IQ, that is over a span of six standard deviations. Spans are represented with different colors for each standard deviation above or below the mean. The plot was created with the following gnuplot code: |
| SVG gelişimi | Bu SVG kaynak kodu geçerlidir. Bu vektörel grafik Gnuplot ile oluşturuldu. Bu SVG dosyası, gömülü metin kolayca çevirebilir. |
| Kaynak kodu | Gnuplot codeset terminal svg name 'IQ_curve' size 600,480 font ',10' rounded
set output 'IQ_curve.svg'
mu = 100.0
sigma = 15.0
from = 55
to = 145
# Normal distribution:
# (continuos normalization approximation, good to ~10 digits in this case)
P(x) = exp(-(x - mu)**2 / (2 * sigma**2)) / (sqrt(2 * pi) * sigma) * 100
# By sigma intervals:
oddsi(x) = (int(abs(x - mu) / sigma) % 2) ^ (x < mu)
Pm(x) = (x == mu) ? P(x) : 1/0 # sample at mu
Po(x) = ( oddsi(x) && (x != mu)) ? P(x) : 1/0 # samples in odd sigma intervals
Pe(x) = (!oddsi(x) && (x != mu)) ? P(x) : 1/0 # samples in even sigma intervals
set key off
set border 3
set xlabel 'IQ'
set xtics 10 out nomirror
set mxtics 2
set ylabel 'Population, %'
set ytics 1 out nomirror
set mytics 2
set samples (to - from + 1)
set style function impulses
plot [x = from:to] \
Pm(x) lw 2, \
Po(x) lw 2, \
Pe(x) lw 2
|
| Tarih | |
| Kaynak | Yükleyenin kendi çalışması |
| Yazar | Alessio Damato, Mikhail Ryazanov |
- ↑ Kaufman, A.S. (2009) IQ Testing 101, New York (NY): Springer Publishing, pp. 104−109 ISBN: 978-0-8261-0629-2.
Lisanslama
Ben, bu işin telif sahibi, burada işi aşağıdaki lisanslar altında yayımlıyorum:

|
Bu belgenin GNU Özgür Belgeleme Lisansı, Sürüm 1.2 veya Özgür Yazılım Vakfı tarafından yayımlanan sonraki herhangi bir sürüm şartları altında bu belgenin kopyalanması, dağıtılması ve/veya değiştirilmesi için izin verilmiştir;
Değişmeyen Bölümler, Ön Kapak Metinleri ve Arka Kapak Metinleri yoktur. Lisansın bir kopyası GNU Özgür Belgeleme Lisansı sayfasında yer almaktadır. |
| Bu dosya, Creative Commons Atıf-Benzer Paylaşım 3.0 Taşınmamış lisansı ile lisanslanmıştır | ||
| ||
| Bu lisanslama etiketi, dosyaya GFDL lisanslama güncelleştirmenin bir parçası olarak eklenmiştir. |
Bu dosya Creative Commons Atıf-Benzer Paylaşım 2.5 Genel, 2.0 Genel ve 1.0 Genel lisansları ile lisanslanmıştır.
- Şu seçeneklerde özgürsünüz:
- paylaşım – eser paylaşımı, dağıtımı ve iletimi
- içeriği değiştirip uyarlama – eser adaptasyonu
- Aşağıdaki koşullar geçerli olacaktır:
- atıf – Esere yazar veya lisans sahibi tarafından belirtilen (ancak sizi ya da eseri kullanımınızı desteklediklerini ileri sürmeyecek bir) şekilde atıfta bulunmalısınız.
- benzer paylaşım – Maddeyi yeniden karıştırır, dönüştürür veya inşa ederseniz, katkılarınızı orijinal olarak aynı veya uyumlu lisans altında dağıtmanız gerekir.
İstediğiniz lisansı seçebilirsiniz.
Dosya geçmişi
Dosyanın herhangi bir zamandaki hâli için ilgili tarih/saat kısmına tıklayın.
| Tarih/Saat | Küçük resim | Boyutlar | Kullanıcı | Yorum | |
|---|---|---|---|---|---|
| güncel | 23.11, 26 Kasım 2020 | | 600 × 480 (9 KB) | Paranaja | Reverted to version as of 21:27, 2 November 2012 (UTC) |
| 21.27, 2 Kasım 2012 |  | 600 × 480 (9 KB) | Mikhail Ryazanov | IQ values are now integers; gnuplot-only approach | |
| 09.20, 6 Aralık 2006 |  | 600 × 480 (12 KB) | Alejo2083 | {{Information |Description= The IQ test is made so that most of the people will score 100 and the distribution will have the shape of a Gaussian function, with a standard deviation of 15. The plot shows the percentage of people getting a score versus the |
Dosya kullanımı
Bu dosyayı kullanan sayfa yok.